
How many scenarios can I compare?
Scenario Planning itself is not capped. In the Decision Dashboard table and its CSV/PDF exports, Professional compares up to five scenarios; the Team plan shows the full scenario ladder.
Scenarios & decision reporting
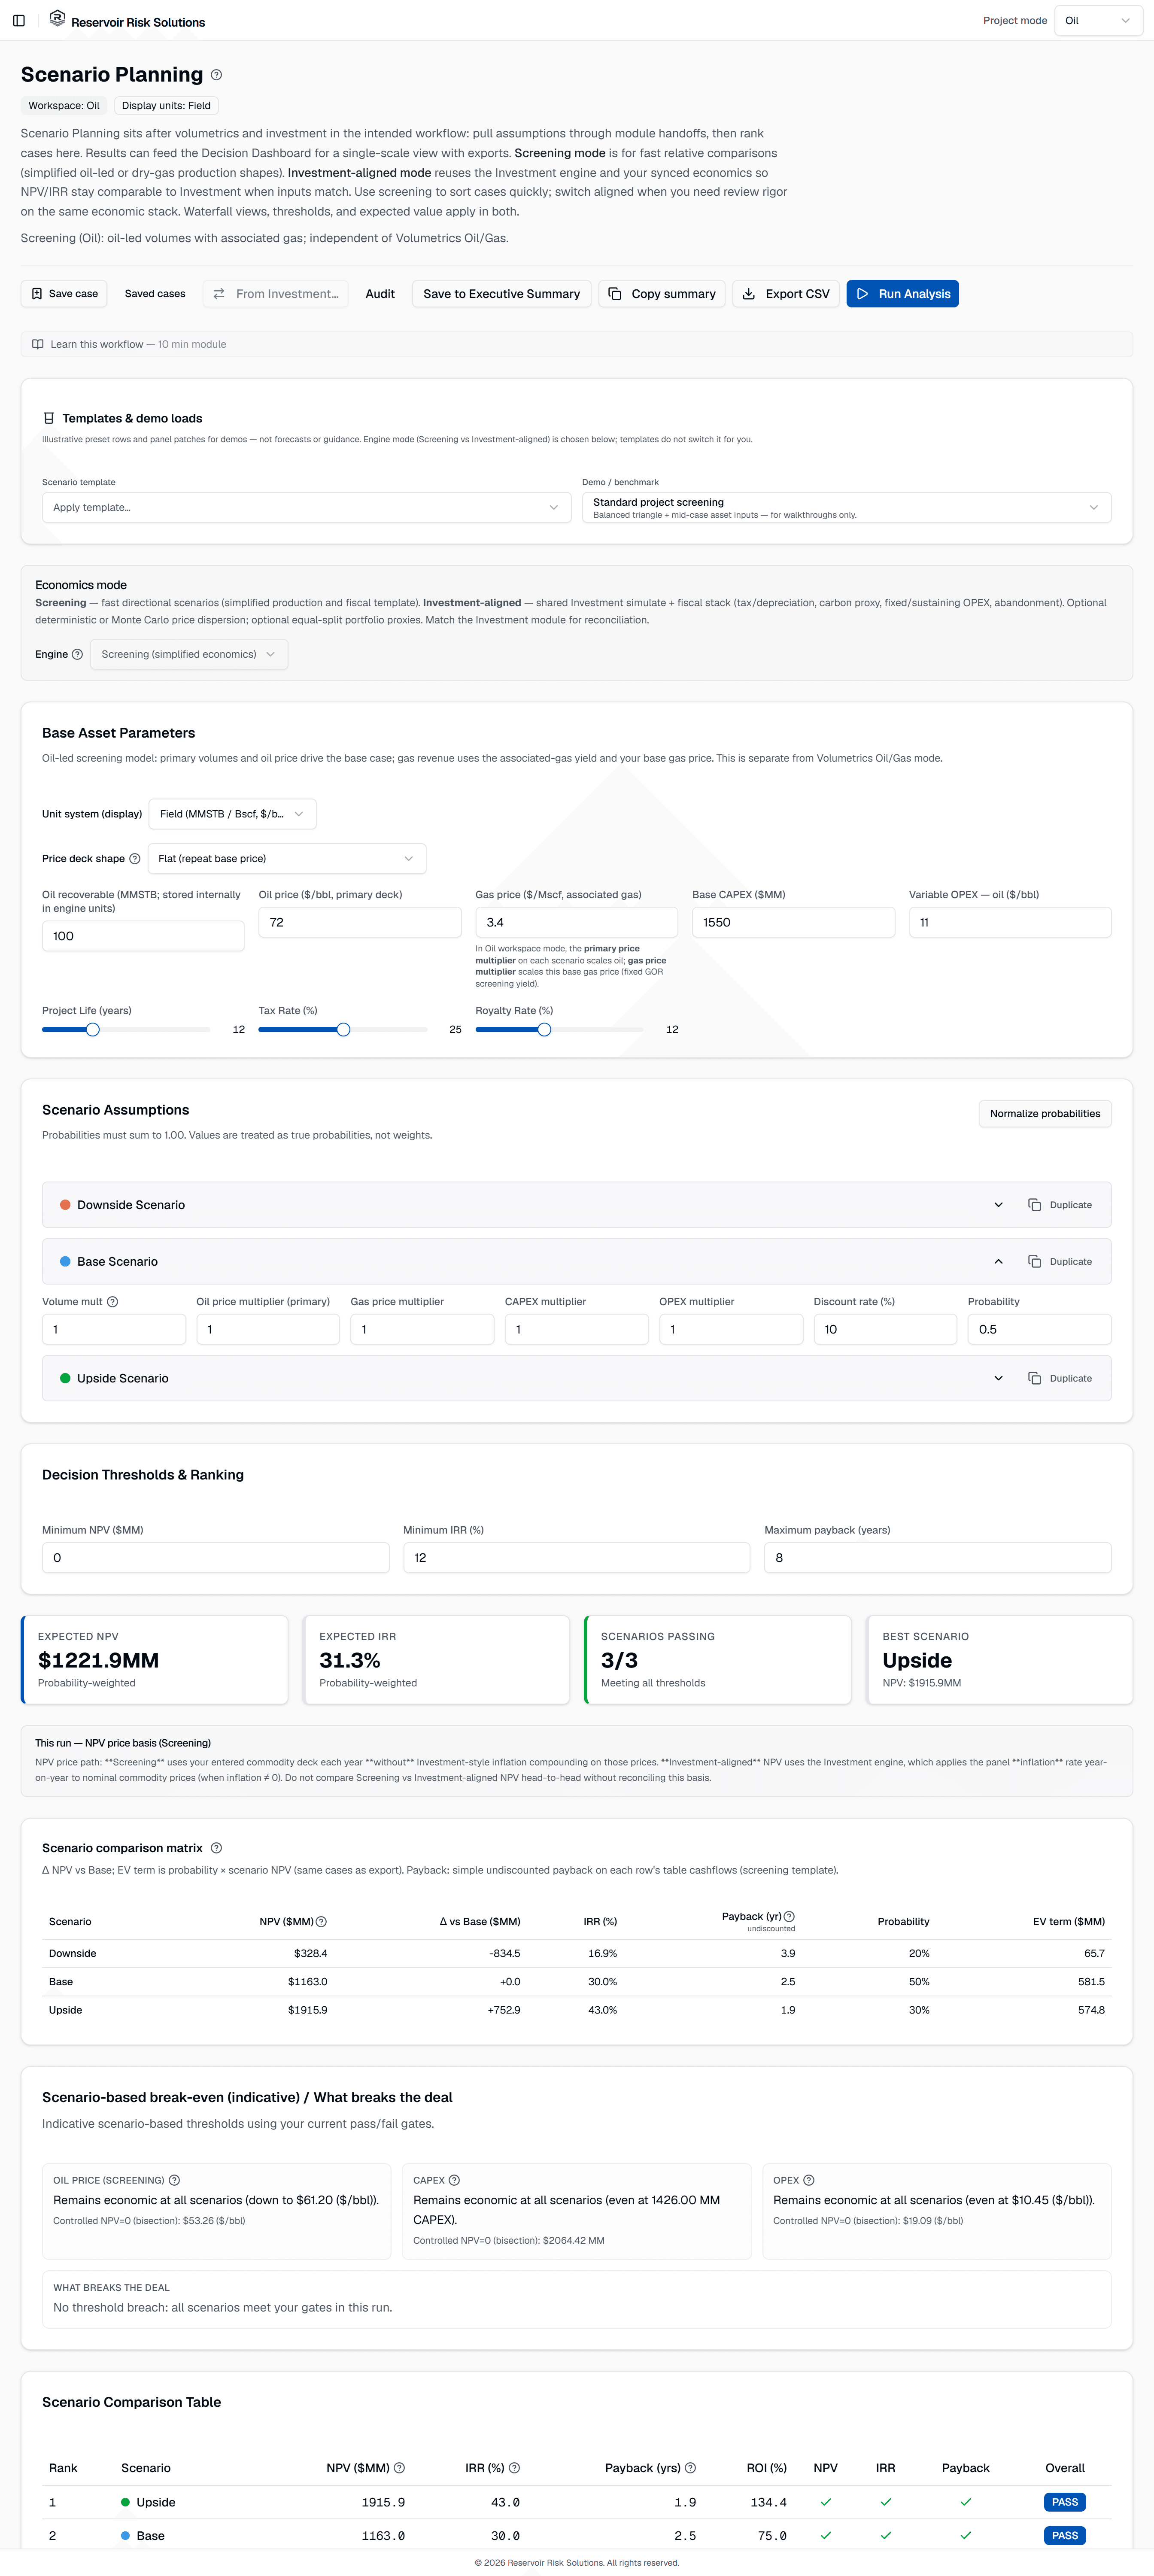
Compare development scenarios against thresholds you set, see what has to be true for each to work, and export a decision record that survives the review, on the same numbers your economics ran on.
This is the end of the workflow: Scenario Planning for ranking cases, the Decision Dashboard for putting them on one scale, and Executive Summary for the memo that leaves the room with the decision. All three read the workspace you have already built, so the story in the memo and the numbers in the model cannot drift apart.
Scenario Planning and the Decision Dashboard are included with the Professional and Team plans. Professional compares up to five scenarios in the Decision Dashboard table and exports; Team sees the full scenario ladder. See pricing
Fast ranking and defensible numbers are different jobs, and pretending one tool does both is how reviews go wrong:
The useful question is rarely "which NPV is biggest"; it is what each case needs in order to work:
The Decision Dashboard puts scenarios on a single NPV scale with sensitivity context, so a reviewer is not asked to compare charts with different axes. Export it as CSV or PDF. Executive Summary takes a snapshot of the workspace and generates a decision memo in your browser (headline numbers, the assumptions behind them, and the narrative) as a PDF or a structured CSV. Saved cases carry a draft, review-ready, and reviewed workflow with last-sync visibility, and on the Team plan cases can be shared read-only with a reviewer note.
In most teams the technical case lives in one tool, the economics in another, and the decision story in slides rebuilt by hand. By the time the deck is finished, nobody can say for certain that the number on the summary slide is the number the model produced. Keeping ranking, dashboard, and memo on the same workspace is not a convenience feature; it is what makes the decision auditable six months later when someone asks why.
Scenario Planning itself is not capped. In the Decision Dashboard table and its CSV/PDF exports, Professional compares up to five scenarios; the Team plan shows the full scenario ladder.
In investment-aligned mode, yes: scenarios run through the Investment engine so the numbers reconcile. Screening mode is deliberately faster and simpler, for ranking candidates before you model them properly; it is not intended to be quoted as the final economics.
No. CSV import covers Volumetrics and Investment in the current release. Scenario inputs come from the workspace or are entered directly.
A snapshot of the workspace: headline figures, the run manifest and key assumptions behind them, and the decision narrative, as a PDF memo or a structured CSV, both generated in your browser.
Scenario ranking, break-even conditions, a single-scale dashboard, and an executive memo generated from the same workspace. Included with Professional and Team.